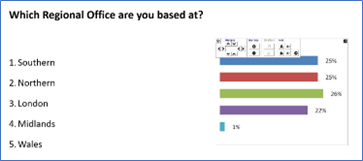
I've inserted a voting slide template, how do I add my question wording and change the graphs to match my question?
Editing the templates to include your wording and to use your slide design, branding, colours etc.
|
Editing Voting Slides |
|||||||||
|
|||||||||
|
|
|||||||||
|
Count Up vs Count Down (timed vote) |
|||||||||
|
The style of vote can be changed from the Voting tab.
Count Up shows a counter on screen that increments as each vote is received.
Count Down shows a timer, you can select how long the timer will run for and also whether you wish to manually start the timer and also manually close the vote (these options are on by default). |
|||||||||
|
|
|||||||||
|
Graphing / Results Settings |
|||||||||
|
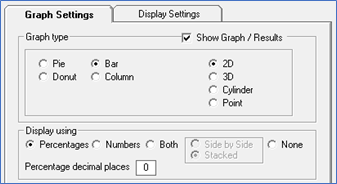
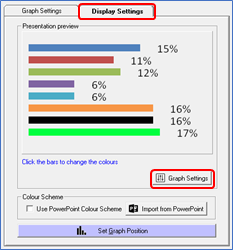
From the main Graphing tab there are two subtabs: Graph Settings & Display Settings.
Graph Settings tab contains options for the style of graph to use and how the results on the graph are to be displayed, e.g. Percentage, Numbers, Both or None. |
|||||||||
|
|
|||||||||
|
|||||||||
|
When you are happy with the basics of what the graph will look like click the Set Graph Position button.
|
