Check the settings on your computer. You need to run voting slides with font zooming set to 100%. A higher percentage will mean that Windows will zoom all the other items on your slide but not the graph, which is why the graph alignment looks wrong.
On the computer, not within PowerPoint, go to Display Settings and scroll down to the Scale & layout section. Then use the drop down to the right of Scale to change it to 100%.
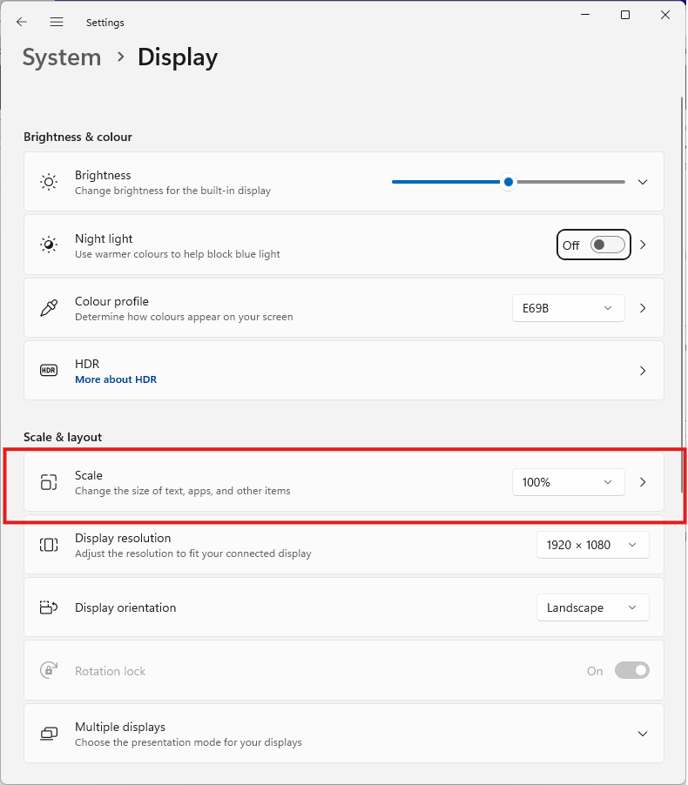
If your screen is capable of very high resolution display, the zooming may have a recommended default setting that is significantly higher than 100%. That makes is much easier to read text and see the icons. Dropping to 100% might make it a little hard for you to use the computer.
If that's the case, you have two options. Only use 100% zooming while you are presenting live and change it back to the recommended zoom after the session, or change your resolution to make it work better with 100% zooming.
The best resolution depends on your screen size and your preference. Try 1366 x 768 as the resolution, as that tends to work well with 100% zooming. If you aren't happy with that try some other resolutions from the drop down until you find one that you are comfortable with.
If you are using duplicate/clone displays, where both screens show identical content, any changes will apply to both screens. If you are using extended desktop, where the external screen shows different content to the main laptop screen, you can adjust each one independently. Just click on the one you need to change at the top of the display settings menu and then apply your changes.
For more information on setting up your computer go to https://knowledge.clikapad.com/setting-up-your-computer