I've inserted a voting slide template, how do I add my question wording and change the graphs to match my question?

Editing the templates to include your wording and to use your slide design, branding, colours etc.

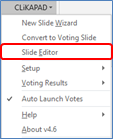
Editing Voting Slides

You may edit the text question and answers within PowerPoint itself. To edit the graph / results or to alter the way the vote runs (e.g. from count up to count down) load the slide editor by selecting CLiKAPAD > Slide Editor.


The Slide Editor function may be used no matter how your voting slides were initially created.


Count Up vs Count Down (timed vote)

The style of vote can be changed from the Voting tab.


Count Up shows a counter on screen that increments as each vote is received.


Count Down shows a timer, you can select how long the timer will run for and also whether you wish to manually start the timer and also manually close the vote (these options are on by default).


Graphing / Results Settings

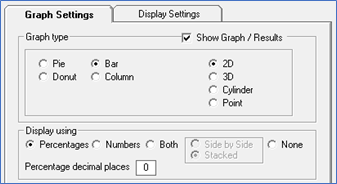
From the main Graphing tab there are two subtabs: Graph Settings & Display Settings.


Graph Settings tab contains options for the style of graph to use and how the results on the graph are to be displayed, e.g. Percentage, Numbers, Both or None.

Display Settings tab shows a preview of what the graph will look like and to make changes to the colours of the bars.


To change the colours of the bars, click on any bar to choose a new colour.


You can change the colour and size of the graph labels by clicking on the Graph Settings button.

Other settings that can be altered from the Graph Settings button are as follows:


§        Font style

§        Font Colour.

§        Font Shadow Colour

§        Text Shadows

§        Make All Same Colour

§        Gradient


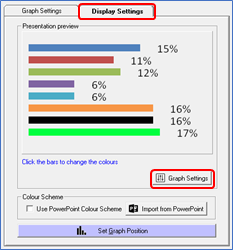
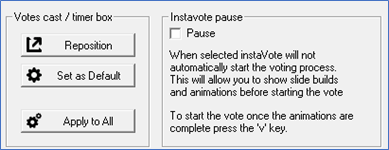
When you are happy with the basics of what the graph will look like click the Set Graph Position button.

The slide show will start full screen.

Click and drag with your mouse to move the graph.


Moving your mouse to either the right or bottom edge of the box allows you to resize the box.

Press Up/Down/Left/Right on your keyboard to nudge the graph, holding Shift nudges the graph more.

Holding Ctrl and pressing Up/Down/Left/Right resizes the graph, holding Shift resizes the graph more quickly.

Use the tool bar to make amendments to the Margins, Bar Size and Font:

When you have the graph positioned to your liking, click on the 'x' button in the top right of the graph window or press Esc to return to the main Editor screen.


Select Next to progress to the Options tab.

Select Reposition to display the Voting Indicator box on the slide. Drag the box to a position where everyone can see it. Once finished, select 'x' to close and return to the ppvote Wizard screen.


Apply to All will set the Voting Indicator position across all voting slides in the presentation to match.


Select Save & Go.